Diagnosing Financial Health: Metrics Meet Information Literacy
Diagnosing and managing the symptoms of financial issues and maintaining financial health haven’t always been top-of-mind for health and human service organizations that were shielded from market forces by cost-based reimbursement and charitable funding. Operating under the misguided notion that non-profits “don’t need to make money” has obscured the realities of what happens when more cash goes out than comes in for many organizations. Financial discipline is just as necessary for organizations that are intently focused on mission-driven service delivery as it is for organizations that prioritize profits. To execute the mission and to serve their communities, organizations must achieve and maintain the financial sustainability that keeps the doors open. Sustainable mission delivery depends on successful financial management, not just service volume.
The current market reality driving the need for an increased focus on successful financial management is three-fold—value-based reimbursement (VBR), shifting payer power, and increased competition. The result is that executive teams need to treat financial health—defined as the stability to generate sufficient resources to invest, operate, and grow—as a core strength. The capability to strategically manage finances is the foundation for gaining market agility and resilience when turbulent times drive the material conditions of the market.
When considering financial health, revenue is often the first topic. The thinking goes that if executives keep revenue high, financial health will follow. But while revenue is an important piece of the picture—derived from reimbursement for services, funded by grants, or accepted as donations, it is only one piece of the financial picture. The full picture must also include current markers and predicted trends for net margin, cash flow, liquidity, debt capacity, and operational efficiency.
The Four-Domain Framework For Financial Assessment
This comprehensive financial health assessment provides visibility into net margin, cash flow, liquidity, debt capacity, and operational efficiency to inform strategic planning and growth plans, along with changes to programs and services (see The OPEN MINDS Financial Strength Calculator). Data for nine elements across four domains—liquidity, performance, leverage, and process efficiency—are needed to paint the needed picture. These indicators are synthesized into a standardized score—ranging from 0 to 20—that mirrors the perspective of lenders, bond agencies, and strategic investors.
Scores above 8 indicate stability, while scores above 12 will mark organizations as market leaders—financially positioned for growth through expansion or acquisition.
Scores below 8 reflect limited resilience and vulnerability to market shocks. Scores below 3 indicate imminent financial risk and suggest the need for rapid restructuring or acquisition.
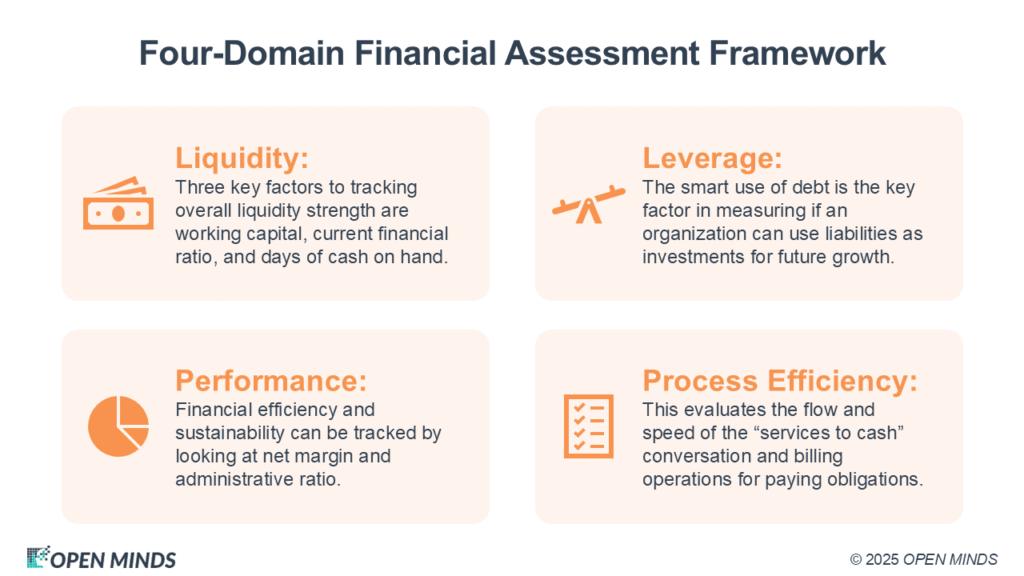
Liquidity: This metric measures short-term solvency and cash availability. Three key factors to tracking overall liquidity strength are working capital, current financial ratio, and days of cash on hand. Here are the definitions of those terms and why they matter.
- Working Capital: Surplus of current assets over liabilities—critical for daily operations and strategic flexibility.
- Current Ratio: A target of 2:1 is a baseline for most provider organizations.
- Days Cash on Hand: A minimum of 45–60 days is acceptable; 90+ days is ideal for growth-focused organizations. Cash provides flexibility, and flexibility creates the freedom to react to market changes strategically.
Performance: Financial efficiency and sustainability can be tracked by looking at net margin and administrative ratio.
- Net Margin: A 5% margin is a benchmark for operational resilience and future investment.
- Administrative Ratio: A balanced 25% ensures infrastructure stability without signaling waste.
Leverage: The smart use of debt is the key factor in measuring whether an organization can use liabilities as investments for future growth.
- Assets-to-Liabilities Ratio: A 2.5:1 ratio signals a healthy debt structure.
- Debt-to-Equity Ratio: Also benchmarked at 2.5:1, this ratio reflects an organization’s borrowing capacity.
Process Efficiency: This evaluates the flow and speed of the “services to cash” conversation and billing operations for paying obligations.
- Days in Accounts Receivable: Faster collections (30–45 days) improve cash flow and agility.
- Days in Payables: Longer payables can extend cash reserves, but must be balanced to avoid damaging vendor relationships.
The Strategic Use Of Financial Intelligence
The financial information gained from this assessment is more than a report card. It is the strategic foundation for corrective action as needed. High-performing executive teams use this financial intelligence to identify where improvements are needed and plan for changes to shift the numbers in the right direction. The data is also used to benchmark against peers and potential acquisition targets, identify readiness for service line expansion or diversification, evaluate risk-bearing capacity in VBR models, and support capital planning and infrastructure investment.
Operationalizing financial data in support of faster, smarter decisions is the path to expanding strategic options. And that can be achieved when executives can point to strong financial performance that is documented, tracked, trended, and shared. Clear, real-time understanding of performance comes from building financial information into a well-designed executive dashboard, pairing that with strong information literacy across the management team, and adapting the organization’s culture to decision-making based on data.
The most strategic and informative financial dashboards distill key performance indicators (KPI) into a centralized, intuitive interface that executives and managers can use to guide daily decision-making and long-term strategy. If it’s tracked, it can be acted on. Data visualization in dashboards makes information available and actionable. For the dashboard to be effective as a tool to guide strategic planning and data-driven decisions, it must deliver the right information, at the right time, in the right format.
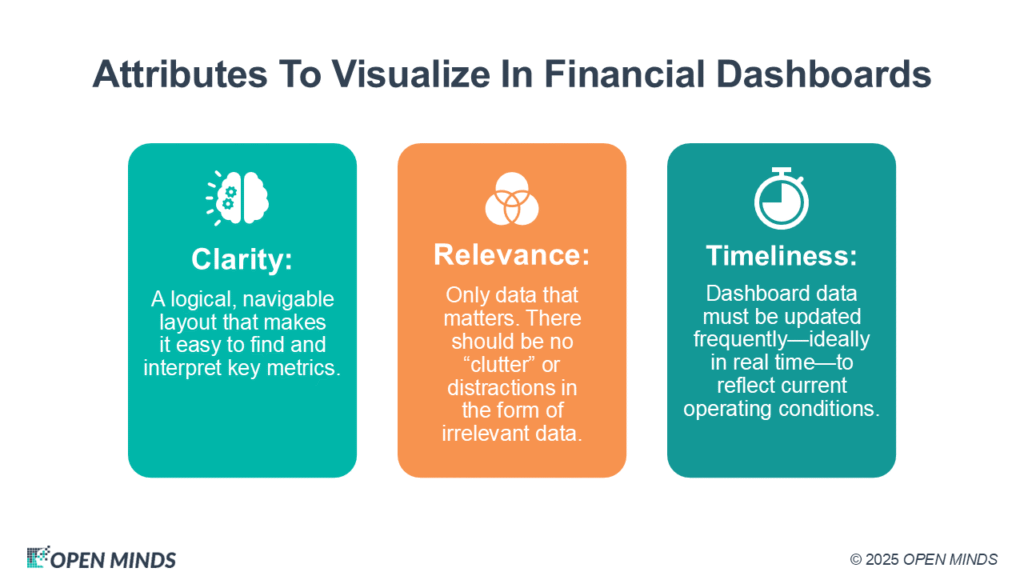
Organizations should prioritize three attributes in building the metrics that are visualized in financial dashboards:
- Clarity: A logical, navigable layout that makes it easy to find and interpret key metrics.
- Relevance: Only data that matters. There should be no “clutter” or distractions in the form of irrelevant data. Feature the reports that are looked at the most often and prioritize them by the KPIs that are most critical to decision making and planning.
- Timeliness: Dashboard data must be updated frequently—ideally in real time—to reflect current operating conditions.
Poorly designed dashboards hinder strategic plans, create information overload, obscure the truth, and ultimately put financial health at risk. On the other hand, effective dashboards inform executives where the organization stands, and create the foundation for strategic and tactical changes that can improve a poor position and strengthen a good one. The key is to track and reveal danger signs in real time—be it cash on hand, accounts receivable, aging accounts, hospitalizations, census fluctuations, billable productivity, or budgetary deviations—so leaders can act rather than react.
Building The Foundation: Information Literacy In Three Phases
Implementing a financial health and organizational data visualization dashboard is only the first step. To drive strategic transformation, executive teams must master the skill of information literacy—the ability to interpret, apply, and act on data. This endeavor can be grouped into three critical phases:
- Retrospective Phase: This is the foundation for metrics-based management, in which organizations first collect reliable data across existing clinical, operational, and financial domains. Accuracy and completeness matter more than volume. This is the core research phase that informs the future success of the project.
- Directive Phase: In this phase, leadership takes control of the data by organizing, visualizing, and distributing it through the dashboard. The goal is to convert raw information into metrics that drive practical insights.
- Predictive Phase: In this phase, data becomes strategy. Advanced organizations use extrapolation, modeling, and forecasting to guide decision-making and lead change. In this phase, the information that dashboards deliver to executives becomes prescriptive.
Truly effective dashboards empower leadership to both assess what’s happening across the organization—in finance metrics and KPIs and in clinical outcomes when that data is also built into metrics that tie to KPIs—and to anticipate what’s next. But the information that is displayed is only as useful as the metrics and KPIs are valid indicators of the past and the present. When executive teams have the analytics maturity that defines an organization’s readiness for data-driven leadership, that will be visualized in the dashboards as clearly as the actual numbers displayed.
This maturity means having standardized and routine operating and management reports drawn from existing systems, a structured blend of financial and non-financial KPIs that track mission-critical activities, comparative data to evaluate organizational standing against industry standards, and the above-mentioned decision-support dashboards that deliver actionable intelligence at the point of need.
Most organizations already have the raw data required to support the financial performance-based management that can enable executives to manage financial health. The question is whether they have the right technology to pull it all together and make it understandable, and whether they can then fold this “single source of truth” into their management decision-making.
What is often lacking is the integrated systems to gather, analyze, and synthesize that raw data. For more on the elements needed for an integrated technology system, refer to this month’s article, Technology-Enabled Financial Health: A Strategic Framework. And to assess your organization’s financial strength, refer to our assessments in The OPEN MINDS Financial Assessment Tools Suite:
- The OPEN MINDS Financial Strength Expansion Compatibility Calculator
- The OPEN MINDS Competitor Financial Analysis Tool
- The OPEN MINDS Financial Sustainability Tool
- The OPEN MINDS Financial Strength Calculator
The executive imperative here is to understand financial health and develop fluency in the numbers that drive sustainability and growth. The shift from treating finances as an accounting function to a strategic leadership concern is already underway. Executives who master the skills and tools needed can continue the journey.